
More than half of all children play team sports, according to the Aspen Institute. The nonprofit think tank’s annual report found that, in 2017, 56.5 percent of children played a team sport at least once during the year. That’s the highest point in six years.
Sports are great for engaging children in exercise and competition, but don’t overlook the relevance of mathematics. After all, statistics are a substantial part of conversations and debates about the greatest players. Some have earned legendary status due to seemingly “untouchable” statistical accomplishments.
Statistics are a significant part of sports, and they illustrate a common and valuable application of math. Here are some ideas to give your students math practice by working with sports statistics across baseball, basketball, and football.
Baseball
Baseball is a statistician’s dream. Hundreds of stats are available in baseball. Ranging from simple to advanced predictive models, those stats can be used to depict hitting, pitching, base running, fielding, and more.
Here are a few ideas to get your students started practicing real-world math skills.
Basic Stats
- Batting average (AVG) is found by dividing a player’s hits by total at-bats. For instance, if a player has 4 hits out of 10 at-bats, that’s a .400 batting average. Provide students with several scenarios for practice with division.
- Earned run average (ERA) is found by multiplying earned runs by 9 and then dividing the result by innings pitched. For example, if a pitcher gives up 3 runs in 6 innings, the ERA would be 4.5. You can keep the numbers easy to work with, or introduce more complicated examples, such as by finding a pitcher’s ERA across several games.
- Total bases (TB) is found by adding the number of bases a batter has through hits. A single is one base, a double is two bases, and so forth. An example would be a batter who hit a single and a triple during one game, which would be 4 total bases. Students simply count the bases for each type of hit and add the totals.
Major League Baseball (MLB) has a glossary of standard baseball stats and a section dedicated to current stats.
Intermediate and Advanced Stats
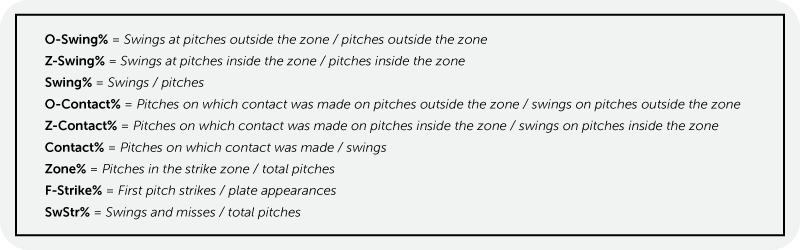
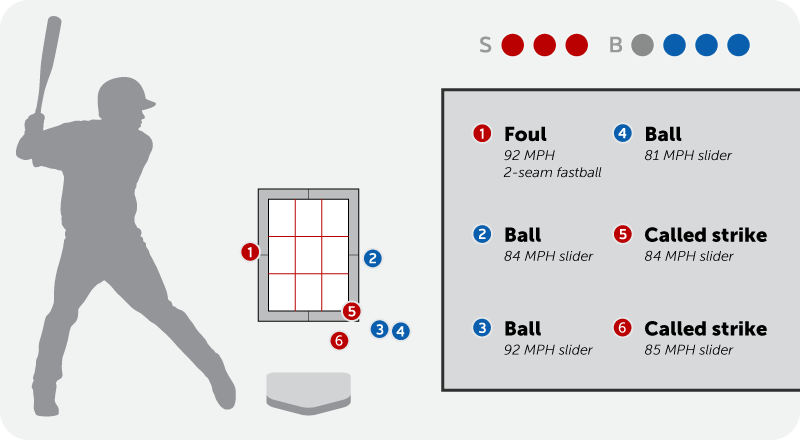
- Fan Graphs has plate discipline statistics that offer several ways to examine batter and pitcher behavior. You could draw a strike zone one a whiteboard and offer pitch-by-pitch information to your students, having them calculate plate discipline statistics. You can add complexity by adding more at-bats for an individual player.
- Pythagorean expectation was developed by Bill James, a renowned baseball writer and statistician, to assess the percentage of games a team should win. The percentage is based on the number of runs scored and allowed. The formula is designed to gauge if a team is over- or under-performing.
MLB has a glossary of advanced baseball stats.
Basketball
In recent years, basketball has enjoyed a statistical resurgence. The sport owes some appreciation to baseball, which has transferred some concepts and stats (like Pythagorean expectation) to the National Basketball Association (NBA).
Here are some ideas to get your students started practicing real-world math skills.
Basic Stats
- Basic stats in basketball like points, assists, rebounds, steals, blocks, and turnovers are known as counting stats. Using these numbers, you can have students find statistical insights, such as minimum, maximum, and median. Another idea is having students come up with the percentage of a team’s counting stats one, two, or three players represented. There are endless opportunities to manipulate data and have students practice math.
- Field goal percentage (FG%) is found by dividing the number of made shots by total number of shot attempts. If a player makes 4 out of 10 shots, the FG% is .400 (or 40%). The same process applies to free throw percentage (FT%) and 3-point percentage (3P%).
The NBA has a section for current and historical stats.
Intermediate and Advanced Stats
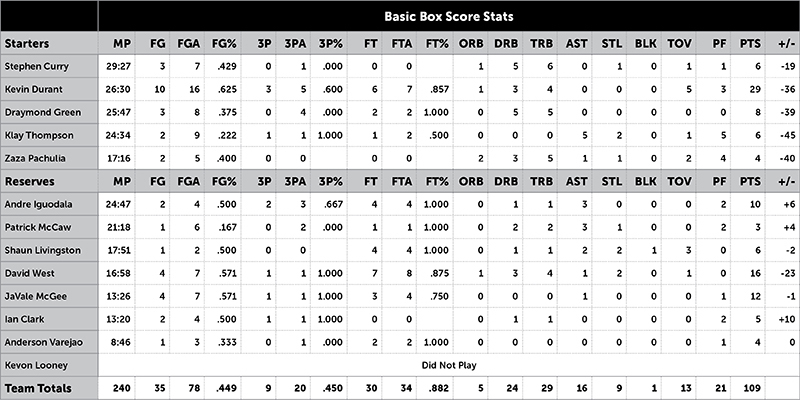
- Effective field goal percentage (eFG%) adjusts for 3-point fields goals being worth more than 2-point field goals. Provide students with a box score and the formula for effective field goal percentage — eFG% = (FGM + (0.5 x 3PTM)) / FGA.
- True shooting percentage (TS%) is an advanced stat that takes a player’s FG%, FT%, and 3P% into account.
Football
Football doesn’t have the statistical backing of baseball and basketball, but things are changing. The sport is, like basketball, benefiting from advanced stats and predictive models. There are plenty of opportunities to practice math with football stats, thanks to the variety of positions and accompanying stats, such as passing, rushing, receiving, defensive, and special team stats.
Here are some ideas to get your students started practicing real-world math skills.
Basic Stats
- Basic passing stats include completion percentage, attempts per game, and yards per game. Those stats can be found by having completions, attempts, and total yards for a span of games.
- Provide students with a list of field goal attempts for a kicker. Students can calculate stats like a kicker’s field goal percentage, longest made field goal, total yards of made field goals, total points, and percentage for a certain distance (e.g., field goal percentage from 50-plus yards).
The National Football League (NFL) has a section for current and historical stats.
Intermediate and Advanced Stats
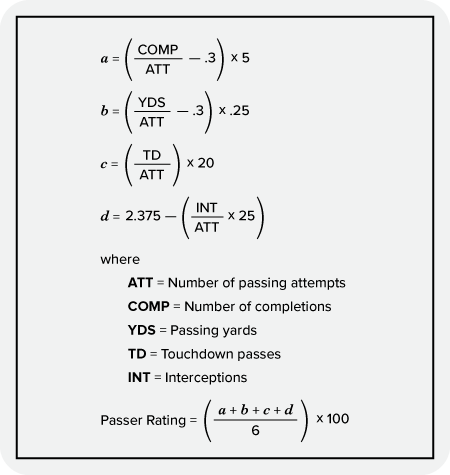
- Passer rating measures a quarterback’s performance using four stats: passing attempts, completions, yards, touchdowns, and interceptions. It involves four separate calculations. If any of those four results is greater than 2.375, it’s reduced to that number, and negative results are set to zero. A perfect passing rating is 158.3. Have students calculate passer ratings for real or fictional quarterbacks.
- Average point differential measures the average scoring margin of a team. It can be positive or negative depending on the team’s performance. The stat is calculating by subtracting points allowed by points scored, and then dividing by the number of games. You can have students calculate this figure and manipulate data more through home/away splits, analyzing trends, and adding older games to the period analyzed.